


Interactive Forex Charts
คำอธิบายของInteractive Forex Charts
**Announcement: Market Data updated for v.2.56
Forex is an exciting financial instrument that offers active traders with abundant opportunities to profit from regular price movements. Because of its high liquidity and 24 hour trading, it is ideal for active traders to trade frequently by taking advantage of predictable price swings, range bounded movements, trend following, trend reversals and trend exhaustions. Screenulator with its experience stock charting analysis finally brings the powerful AI chart pattern recognition engine, and industry leading interactive charting app to Forex market.
The app is based on Interactive Stock Charts app © with advanced yet intuitive, easy to use touch screen interface allowing you to freely adjust time frame and view technical information with touch of finger: scroll, pan and zoom on a beautiful candlestick charts with gesture and touch control. Swipe to scroll into historical analysis, pinch to zoom and change time frame, touch on price points to show detailed quotes and technical indicator values. Backed by Screenulator's patent pending automated chart pattern and trendline recognition engine, and industry's first Trend Reversal (9,13 count Sequential) pattern screener, and full suite of technical analysis tools, you will have the best analysis tool for Forex trading!
Screenulator.com uses the AI based chart pattern recognition and automated trendline capabilities, as well as state of the art TR/TD short term signals. By using machine Deep Learning Neural Networks algorithms, the selected stocks with desired chart patterns and TR/TD signals are highly reliable and profitable.
About Trend Reversal Indicator:
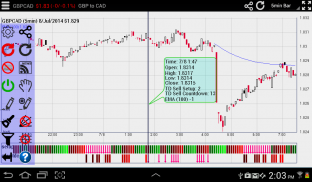
Screenulator's patent pending Trend Reversal and Exhaustion indicators combines 9,13 counting with trendline analysis to pinpoint trend pivots with color coded visual indicator. It has been shown to have an impressive record of identifying and anticipating turning points across the FX, bond, equity and commodity markets. Furthermore, the indicators provide signals not only on a daily chart but also intraday. It identifies when a trend is becoming, or has become, exhausted. This apps automatically identifies Trend Reversal, Trend Exhaustion, and Perfection criteria. It also calculates stoploss levels. To learn more: http://www.screenulator.com/show_video.php?id=TR_EXAMPLES
http://www.screenulator.com/cgi-bin/v?pid=ref#reversal
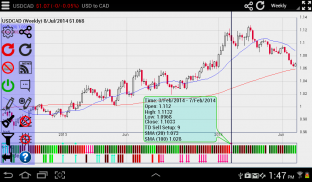
Top 40 Forex pairs are supported for both intraday, daily, weekly time frames. You can pinch zoom to change time frames easily. Touch the price candle to display information.
About Trendlines:
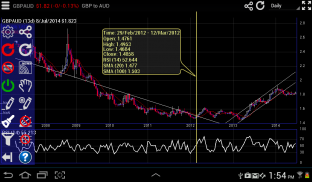
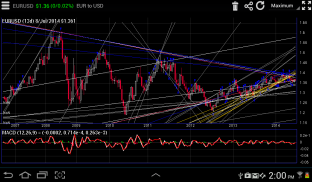
A trend line is a bounding line for the price movement of a security. A support trend line (or a bottom line) is formed when a securities price decreases and then rebounds at a pivot point that aligns with at least two previous support pivot points. Trendlines are considered by many expert traders to be the single most important tools in technical analysis. However, Support and Resistance breakout and Triangle patterns are just example of patterns formed by trendlines. This app automatically draws and screens for stocks with specific patterns. To learn more: http://www.screenulator.com/cgi-bin/v?pid=ref#trendlines
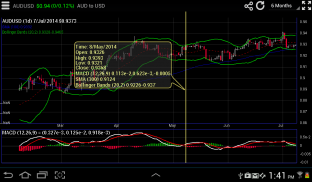
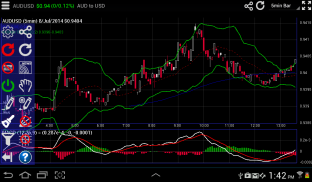
Classic TA indicators and overlays: RSI, MACD, SMA, EMA, Bollinger, Donchian, Ichimoku Cloud, Keltner band, Parabolic SAR, SuperTrend, McGinley Dynamic, stochastic, ADX, Aroon, Chaikin, Ultimate, MFI, OBV, ATR, ADL, CCI indicators. Fibonacci Retracement and text annotation tools. Others will available upon requests.
Supported markets:
EOD and intraday data: NASDAQ, NYSE, AMEX, TSX, HKEX, Australia, India (NSE)
EOD data only: JKSE, Shenzhen, Shanghai, Singapore, UK, Paris, Brussels, Amsterdam, Milan, Athens
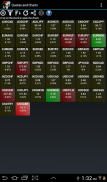
FOREX: All Forex currency pairs
** ประกาศ: ข้อมูลการตลาดที่ปรับปรุงแล้วสำหรับ v.2.56
Forex เป็นเครื่องมือทางการเงินที่น่าตื่นเต้นที่มีผู้ค้าที่ใช้งานกับโอกาสมากมายที่จะทำกำไรจากการเคลื่อนไหวของราคาปกติ เพราะสภาพคล่องสูงและการซื้อขายตลอด 24 ชั่วโมงเป็นที่เหมาะสำหรับผู้ค้าที่ใช้งานบ่อยเพื่อการค้าโดยการใช้ประโยชน์จากชิงช้าราคาที่คาดการณ์ช่วงขอบเขตการเคลื่อนไหวแนวโน้มต่อไปนี้การพลิกผันแนวโน้มและ exhaustions แนวโน้ม Screenulator กับการวิเคราะห์ประสบการณ์การสร้างแผนภูมิหุ้นของตนในที่สุดก็นำที่มีประสิทธิภาพ AI เครื่องยนต์จดจำรูปแบบแผนภูมิและอุตสาหกรรมชั้นนำแอปการสร้างแผนภูมิการโต้ตอบเพื่อตลาด Forex
แอปจะขึ้นอยู่กับอินเตอร์แอคทีแจ้งแอปชาร์ต©กับขั้นสูงยังใช้งานง่ายและง่ายต่อการใช้อินเตอร์เฟซหน้าจอสัมผัสช่วยให้คุณสามารถปรับได้อย่างอิสระกรอบเวลาและดูข้อมูลทางเทคนิคกับสัมผัสของนิ้วมือ: เลื่อนแพนและซูมบนแผนภูมิเชิงเทียนที่สวยงามด้วยท่าทางและ การควบคุมแบบสัมผัส กวาดเพื่อเลื่อนในการวิเคราะห์ประวัติศาสตร์หยิกเพื่อซูมเข้าและเปลี่ยนกรอบเวลาที่สัมผัสกับจุดราคาที่จะแสดงคำพูดรายละเอียดและค่าบ่งชี้ทางเทคนิค การสนับสนุนจากสิทธิบัตรที่รอการ Screenulator ของรูปแบบอัตโนมัติแผนภูมิและเครื่องยนต์ได้รับการยอมรับเส้นแนวโน้มและอุตสาหกรรมครั้งแรกของการกลับรายการเทรนด์ (9,13 นับลำดับ) รูปแบบ Screener และชุดเต็มของเครื่องมือในการวิเคราะห์ทางเทคนิคคุณจะมีเครื่องมือในการวิเคราะห์ที่ดีที่สุดสำหรับการซื้อขาย Forex!
Screenulator.com ใช้การรับรู้ AI ตามรูปแบบแผนภูมิเส้นแนวโน้มและความสามารถโดยอัตโนมัติเช่นเดียวกับรัฐของศิลปะ TR / TD สั้นสัญญาณคำว่า โดยการใช้เครื่องอัลกอริทึมลึกการเรียนรู้เครือข่ายประสาทเทียมหุ้นที่เลือกด้วยต้องการรูปแบบกราฟและ TR / สัญญาณ TD เป็นอย่างสูงที่เชื่อถือได้และผลกำไร
เกี่ยวกับแนวโน้มดัชนีกลับรายการ:
สิทธิบัตร Screenulator ของที่รอการโอนกลับเทรนด์และอ่อนเพลียตัวชี้วัดรวม 9,13 นับกับการวิเคราะห์เส้นแนวโน้มที่จะระบุแนวโน้มปรับหมุนได้ด้วยรหัสสีตัวบ่งชี้ที่มองเห็น มันได้รับการแสดงที่มีสถิติที่ยอดเยี่ยมในการระบุและการคาดการณ์จุดหักเหใน FX, พันธบัตร, ตราสารทุนและตลาดสินค้าโภคภัณฑ์ นอกจากนี้ตัวชี้วัดที่ให้สัญญาณไม่เพียง แต่ในกราฟรายวัน แต่ยังระหว่างวัน โดยจะระบุเมื่อแนวโน้มจะกลายเป็นหรือได้กลายเป็นหมด ปพลิเคชันนี้ระบุโอนกลับเทรนด์เทรนด์อ่อนเพลียและเกณฑ์ความสมบูรณ์แบบอัตโนมัติ นอกจากนี้ยังคำนวณระดับ StopLoss ต้องการเรียนรู้เพิ่มเติม: http://www.screenulator.com/show_video.php?id=TR_EXAMPLES
http://www.screenulator.com/cgi-bin/v?pid=ref#reversal
สูงสุด 40 Forex คู่ได้รับการสนับสนุนสำหรับทั้งระหว่างวัน, รายวัน, รายสัปดาห์กรอบเวลา คุณสามารถหยิกซูมเพื่อเปลี่ยนกรอบเวลาได้อย่างง่ายดาย แตะเทียนราคาเพื่อแสดงข้อมูล
เกี่ยวกับเส้นแนวโน้ม:
เส้นแนวโน้มเป็นเส้นขอบเขตสำหรับการเคลื่อนไหวของราคาของการรักษาความปลอดภัย เส้นแนวโน้มการสนับสนุน (หรือบรรทัดด้านล่าง) จะเกิดขึ้นเมื่อราคาหลักทรัพย์ลดลงแล้วรีบาวน์ในจุดหมุนที่สอดคล้องกับอย่างน้อยสองจุดสนับสนุนเดือยก่อนหน้านี้ เส้นแนวโน้มได้รับการพิจารณาโดยผู้ค้าผู้เชี่ยวชาญมากจะเป็นเครื่องมือที่สำคัญที่สุดเพียงอย่างเดียวในการวิเคราะห์ทางเทคนิค อย่างไรก็ตามการสนับสนุนและการต่อต้านการฝ่าวงล้อมและสามเหลี่ยมรูปเป็นเพียงตัวอย่างของรูปแบบที่เกิดขึ้นจากเส้นแนวโน้ม app นี้ดึงและหน้าจอสำหรับหุ้นที่มีรูปแบบเฉพาะเจาะจงโดยอัตโนมัติ ต้องการเรียนรู้เพิ่มเติม: http://www.screenulator.com/cgi-bin/v?pid=ref#trendlines
คลาสสิก TA ตัวชี้วัดและภาพซ้อนทับ: RSI, MACD, SMA, EMA, Bollinger, Donchian, Ichimoku เมฆเคลท์วง Parabolic SAR, SuperTrend, McGinley แบบไดนามิกสุ่ม ADX, อรุณ, Chaikin, Ultimate, MFI, OBV, ATR, ADL, หุ้น CCI Fibonacci retracement และเครื่องมือบันทึกย่อข้อความ คนอื่นจะใช้ได้ตามคำขอ
ตลาดที่รองรับ:
EOD และระหว่างวันข้อมูล: NASDAQ, NYSE, AMEX, TSX, HKEX, ออสเตรเลีย, อินเดีย (NSE)
EOD ข้อมูลเท่านั้น: JKSE เซินเจิ้น, เซี่ยงไฮ้, สิงคโปร์, สหราชอาณาจักร, ปารีส, บรัสเซลส์, อัมสเตอร์ดัม, มิลาน, เอเธนส์
FOREX: ทั้งหมด Forex สกุลเงินคู่
Interactive Forex Charts - ข้อมูล APK
เวอร์ชั่น APK: 2.34แพ็คเกจ: com.screenulator.forexเวอร์ชั่นล่าสุดของInteractive Forex Charts
เวอร์ชั่นอื่น


 3.96
3.96
แอปในประเภทเดียวกัน


